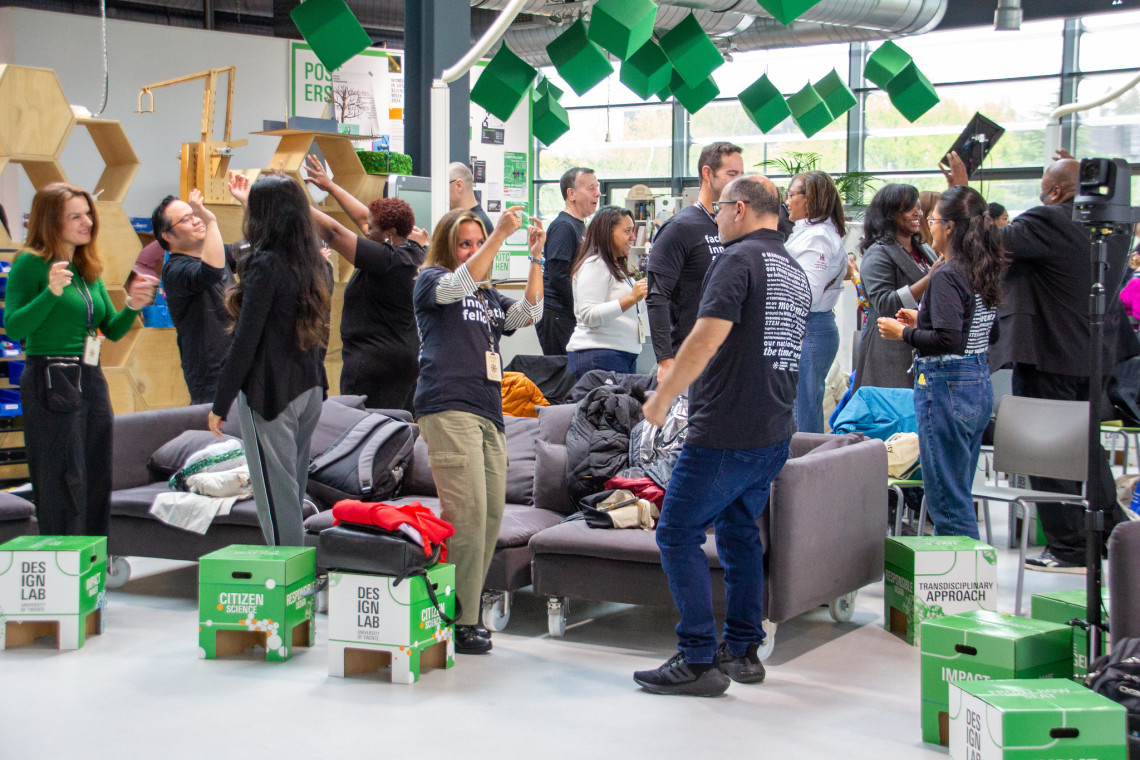
UT students Yacintha Aakster and Martijn Bergsma are DreamTeamers who help organise the camp. Aakster tells us about the goal of the event. ‘Data is a hot topic, but it is often hard to decipher a clear result or message from a certain dataset or graph. It is important that people understand the data correctly, which is why it is important to process the data in a correct way and to visualize it so that the challenges that can be taken from it are clear. We decided to focus on the SDGs during this event, in particular we aim to visualize inequalities in areas like gender, income, social mobility and access to education and health services.’
The teams of participants are working on eight different challenges. ‘There is, for example, a challenge regarding accessibility of transport in Colombia, but also a more local one from the Province of Overijssel that wants more insight into the small initiatives from inhabitants of the region’, says Aakster. Three participants are people from the public TV network NTR, who are working on a pilot for a potential web series about data visualization.
Graphics for good
Yuri Engelhardt, assistant professor of the ITC faculty, and Frank Kresin, managing director of the DesignLab, were the ones who initiated the event. Engelhardt says: ‘It was a dream of mine to organise a data camp, I was inspired by Visualizar, which is a famous data visualization camp in Spain. I discussed this idea with Frank and together we were able to make it happen at the UT.’
Engelhardt is satisfied with the camp so far. ‘The DreamTeamers are working very hard to make the week successful and I love to see everyone so passionate about their challenges. The fact that we are focussing on inequalities and the SDG’s makes it even better for me, it is two of my passions combined: visualizing data and doing something for people and the planet. I like to call it ‘graphics for good’’.
Keynotes
The week has been filled with talks from interesting keynote speakers, Aakster says: ‘Frédérik Ruys, who has worked for the Dutch tv-programme ‘Nederland van Boven’ gave a talk, as well as Maarten Lambrechts, who is an expert on xenographics, which are basically very extreme data visualizations.’ Filip de Blois, who gave a talk in the morning, was still walking around the lab when we visited. He is a graphics editor at the PBL Netherlands Environmental Assessment Agency. ‘I work on data visualization and infographics for policy makers, to aid them in making informed decisions about policies regarding the environment’, says de Blois.
Inequalities in Curacao
José Requena, a journalist from Spain who currently lives in Hamburg, is one of the participants of the camp. ‘I decided a while ago that I want to become a data journalist, so I started looking into the possibilities in this field by tapping into the network I had already built up over the past few years. Through one of the people I knew from the dataviz network, I came across this event and signed up to join.’
Requena is working on a data challenge regarding inequalities in Curacao, which were researched by the CBS. ‘Citizens filled out a questionnaire about gender, income and other possible inequalities and we are now working on a visualization of the results. We are going to make a spider graph to show where these people feel that there are inequalities in their country. The graph we make might give the CBS new insights into the data and allow them to get new insights about the results.’
The journalist finds the event very valuable. ‘I like that I am now in touch with what I want to learn and discover. I’ve met people whose work I’ve seen and read and I’m very inspired by them to further pursue a career in the dataviz area.’